
Your reports take hours to load. Your engineers are drowning in query timeouts, skewed joins, and runaway cluster costs. Meanwhile, the business is asking why the BI dashboard still shows yesterday’s data at noon.
This isn’t a Databricks limitation – it’s an architecture and configuration problem. And it’s exactly what Dateonic fixes.
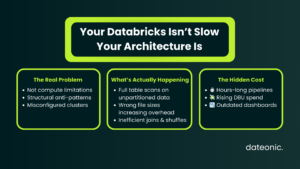
Why Your Databricks Pipelines Are Slow (And It’s Not What You Think)
Most performance issues we diagnose aren’t caused by insufficient compute. They’re caused by structural anti-patterns that compound over time: wrong file sizes, missing Z-order indexes, unpartitioned Delta tables queried by full scan, and clusters provisioned for the wrong workload type.
The result? You’re paying for Photon but running on legacy execution paths. You have Unity Catalog set up but data lineage isn’t helping you catch the 400MB shuffle that’s killing your SLA.
The Most Expensive Anti-Patterns We See in Production
- Small file problem – thousands of 1–5 MB files in Delta tables causing excessive metadata overhead on reads
- Over-partitioning – partitioning by high-cardinality columns like user_id or order_id instead of natural time boundaries
- Broadcast join misuse – forcing broadcast hints on tables >200MB, spilling to disk and collapsing executor memory
- Auto-scaling misconfiguration – clusters scaling down mid-stage during complex aggregations, triggering costly recomputation
- Unoptimized serialization – Kryo not enabled, or UDFs written in Python bypassing the Photon vectorized engine entirely
- Stale statistics – ANALYZE TABLE never run, causing the optimizer to make catastrophically wrong join order decisions
Advanced Tuning Levers Your Team May Not Be Using
Liquid Clustering vs. Z-Order: Choosing the Right Strategy
Z-Order is battle-tested but requires explicit OPTIMIZE runs and struggles with multi-dimensional filter patterns that change over time. Liquid Clustering – introduced in Databricks Runtime 13.3 – rewrites the clustering logic incrementally and adapts to evolving query patterns without full table rewrites.
| Feature | Z-Order | Liquid Clustering |
|---|---|---|
| Requires manual OPTIMIZE | Yes | No (incremental) |
| Multi-column filtering | Limited | Optimized |
| Suitable for streaming tables | No | Yes |
| Runtime requirement | Any | DBR 13.3+ |
| File skipping effectiveness | High (static) | High (adaptive) |
For tables with >100GB and mixed access patterns across 3+ filter dimensions, Liquid Clustering consistently outperforms Z-Order in our benchmarks – typically by 30–60% on scan time.
Photon Engine: Are You Actually Using It?
Photon is enabled at the cluster level, but it silently falls back to JVM execution in several common scenarios:
- Python UDFs (including pandas_udf without Arrow optimization)
- mapInPandas without explicit schema enforcement
- Certain window functions with unboundedPreceding frames
- Complex nested struct operations without flattening
The fix: audit your query plans via EXPLAIN EXTENDED or the Spark UI’s SQL tab. Look for PhotonResultStage nodes – if they’re absent on your heaviest transformations, you’re leaving Photon’s vectorized execution on the table.
Adaptive Query Execution (AQE) – Turn It On, Then Tune It
AQE (spark.sql.adaptive.execution.enabled = true) is enabled by default in DBR 10+, but the default thresholds are wrong for most enterprise workloads:
SET spark.sql.adaptive.skewJoin.enabled = true;
SET spark.sql.adaptive.skewJoin.skewedPartitionThresholdInBytes = 256MB;
SET spark.sql.adaptive.coalescePartitions.minPartitionNum = 200;
SET spark.sql.adaptive.advisoryPartitionSizeInBytes = 128MB;
Skew join handling alone – when properly configured for your data distribution – can reduce the wall-clock time of a slow join from 45 minutes to under 4 minutes. We’ve seen it repeatedly.
Delta Table Maintenance: The Silent Performance Killer
Unvacuumed Delta tables accumulate tombstone files that the transaction log must process on every read. Combined with uncompacted logs, this creates a metadata overhead that scales with table age, not table size.
A proper maintenance cadence looks like this:
— Run weekly on large tables
OPTIMIZE schema.large_fact_table ZORDER BY (event_date, region_id);
VACUUM schema.large_fact_table RETAIN 168 HOURS;
ANALYZE TABLE schema.large_fact_table COMPUTE STATISTICS FOR ALL COLUMNS;
For streaming Delta tables, configure auto-compaction and optimized writes at the table property level – don’t rely on manual jobs that engineers forget to run.
The Dateonic Performance Tuning Methodology
We don’t run generic optimization scripts. Every engagement follows a structured diagnostic-to-delivery process built specifically for Databricks environments.
Step 1: Workload Audit (Days 1–3)
We connect to your workspace via Unity Catalog and pull Query History API data across the last 30–90 days. We identify the top 20 slowest queries, the top 10 most expensive clusters by DBU, and every job with a P99 runtime >2x its median. No guesswork – pure telemetry.
Step 2: Root Cause Classification (Days 3–5)
Each bottleneck is classified into one of four categories: compute misconfiguration, data layout, query logic, or platform configuration. This determines which engineer on our team owns the fix and what the estimated effort is.
Step 3: Refactor & Implement (Days 5–15)
We deliver concrete changes – not recommendations in a PDF. This includes schema refactoring, cluster policy rewrites, Liquid Clustering migrations, AQE configuration, and replacement of Python UDFs with native Spark or SQL equivalents where applicable.
Step 4: Benchmarking & Handover (Days 15–20)
Every change is benchmarked against the baseline captured in Step 1. We deliver a performance delta report showing before/after metrics: query runtime, DBU consumption, shuffle read bytes, and job success rate. Your team receives full documentation and runbooks.
💡 Ready to fix this? If your pipelines are missing SLAs and your cloud bill keeps climbing, Dateonic’s performance tuning engagement delivers measurable results within 20 business days. Request a Performance Tuning Engagement →
What This Looks Like in Practice
Recently, we engaged a mid-market logistics firm running approximately 600 DBUs per day across a Databricks lakehouse handling 8TB of daily telemetry ingestion. Their core reporting jobs – feeding a Tableau environment used by 200+ analysts – were averaging 3.5 hours per run, frequently breaching their 6AM SLA and triggering manual interventions every week.
Our audit identified three compounding issues: a fact table with 4.2 million small files from an untuned Structured Streaming job, a critical join against a 90GB dimension table not being broadcast correctly due to a stale spark.sql.autoBroadcastJoinThreshold setting, and Python UDFs on the transformation layer bypassing Photon entirely.
After a 17-day engagement – table restructuring with Liquid Clustering, UDF rewrite to Spark SQL, and AQE skew join tuning – their reporting jobs dropped to 38 minutes average runtime. DBU consumption fell by 43%. The SLA breach rate went from weekly to zero in the first month post-deployment.
The Business Case for Investing in Databricks Performance Tuning
Slow pipelines have a compounding cost that most teams underestimate:
- Direct cost: DBUs wasted on inefficient compute – often 30–50% of monthly spend
- Indirect cost: engineer hours spent on manual retries, incident response, and stakeholder communication
- Opportunity cost: delayed insights mean delayed decisions – product launches, inventory adjustments, fraud detection
A well-tuned Databricks environment doesn’t just run faster. It runs cheaper, more reliably, and with a smaller operational surface for your team to maintain.
At Dateonic, we’ve run this engagement for logistics firms, financial services companies, and retail enterprises. The pattern is consistent: organizations that invest in a structured tuning engagement recover the cost within 60–90 days through DBU savings alone – before counting the engineering hours freed up or the SLA improvements delivered to the business.
Your pipelines should not be taking hours. They won’t, after we’re done.
Contact our Databricks Experts to Schedule Your Performance Audit →