
Most Databricks vs Snowflake cost comparisons begin with the price of a DBU or Snowflake credit. That is useful for checking an invoice, but it is not enough for a platform decision.
A credible total cost of ownership model must compare the cost of delivering the same business outcome: the same data volume, refresh frequency, query concurrency, response-time target, reliability level, security controls, and AI workload.
It must also include the people required to build and operate the platform.
This article focuses exclusively on that financial comparison. For architecture, performance, governance, and feature differences, read our broader Databricks vs Snowflake comparison.
Databricks vs Snowflake TCO: the short answer
Neither platform is universally cheaper.
Snowflake can have a lower TCO for a predictable, SQL-first analytics environment when the organization already has a strong warehouse team and limited data science requirements.
Databricks can have a lower TCO when the workload combines high-volume data engineering, streaming, machine learning, and AI, especially if one lakehouse replaces several separate tools.
The decisive variable is often not storage or the advertised compute rate. It is the combination of:
- compute efficiency at the required service level;
- idle time and scaling behavior;
- administration and engineering labor;
- data movement between systems, clouds, or regions;
- managed, serverless, and AI feature consumption;
- the number of additional tools the target architecture still requires.
The only defensible conclusion comes from a representative pilot using the organization’s negotiated rates and measured usage.
Use the right TCO formula
For a steady-state annual comparison, use:
Annual TCO = core compute + storage + data transfer and networking + managed/serverless services + AI consumption + platform administration + engineering labor + third-party tooling and support
Keep one-time transition costs in a separate line:
Transition cost = migration engineering + dual-running period + data movement + testing + training + temporary productivity loss
This distinction matters. A platform with lower recurring TCO can still have a long payback period if migration is expensive.
TCO should also remain separate from ROI. TCO measures cost. ROI compares financial benefit with investment. Subtracting a speculative “AI return” from platform cost makes the model difficult to audit and can hide an otherwise expensive design.
Normalize the workload before comparing prices
Do not compare a Snowflake warehouse with a Databricks cluster based only on their labels or hourly rates. Compare the resources required to meet the same output and service-level objective.
| Input | What to record |
|---|---|
| Data footprint | Average stored TB, daily growth, retention, replicas, checkpoints, historical versions, and backup requirements |
| Ingestion and transformation | GB or TB processed per day, batch windows, streaming throughput, pipeline count, and retry rate |
| Analytics | Queries per day, concurrency, peak window, dashboard refresh frequency, and target latency |
| Reliability | Availability target, recovery time, recovery point, and disaster-recovery topology |
| AI and ML | Training hours, endpoint uptime, requests, input and output tokens, vector index size, and retraining frequency |
| Data movement | Ingress, egress, cross-region traffic, cross-cloud traffic, BI extracts, and data sharing |
| Team | Platform, FinOps, security, data engineering, analytics engineering, and ML engineering FTE allocation |
| Commercial terms | Edition, region, cloud, contracted unit rates, commitments, support, discounts, and unused commitment risk |
Measure both average and peak demand. A monthly average can hide a costly concurrency peak, while a peak-only model can overstate the cost of a platform that scales down effectively.
How Snowflake costs should be modeled
Snowflake identifies compute, storage, and data transfer as its foundational cost categories.
Compute
User-managed virtual warehouses consume credits according to warehouse size, the number of clusters, and active time. Snowflake uses per-second billing after a 60-second minimum each time a warehouse starts or resumes.
Warehouses do not consume credits while suspended. Snowflake-managed serverless features and the cloud services layer can also consume credits under their respective billing rules.
The detailed mechanics are described in Snowflake’s compute cost documentation.
A practical monthly compute formula is:
Warehouse cost = sum of active warehouse hours × credits per hour × contracted price per credit
Then add billed serverless usage and any billable cloud services usage. Do not calculate the cost from nominal warehouse uptime alone. Repeated resumes, multi-cluster scaling, serverless features, and workload overlap can materially change the result.
Storage
Snowflake storage is billed from the average daily on-disk bytes stored during the month. The effective rate varies by region and commercial terms.
Model the billed, compressed footprint rather than the uncompressed source size, and include the effect of retention and recovery policies.
Data transfer
Snowflake does not charge to bring data into the account, but transfer charges can apply when data moves to another region on the same cloud or to a different cloud.
Include cross-region replication, cross-cloud sharing, unloads, and downstream systems in the transfer model.
AI and managed services
Snowflake AI features do not all follow the same meter. Current Snowflake AI pricing documentation distinguishes AI Credit consumption for features such as Cortex Agents, Cortex REST API, AI Functions, Cortex Search, and AI Parse Document.
Some costs are token-based, while others depend on indexed data, serving, pages, messages, or underlying services. SQL generated by an AI feature may also incur ordinary warehouse compute.
The financial model must therefore include every meter invoked by the end-to-end workflow, not just the headline model-inference rate.
How Databricks costs should be modeled
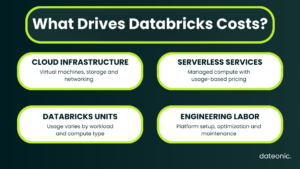
Databricks pricing varies by cloud, region, product, compute type, and contract. The platform uses Databricks Units, or DBUs, as a usage unit, but a DBU is not a complete TCO metric by itself.
Classic compute
For classic compute, the total usually includes:
Classic compute cost = DBUs × effective DBU rate + cloud virtual machines + disks + network charges
The cloud infrastructure charge must not be omitted. Databricks’ own cost optimization guidance states that total classic-compute costs include DBUs plus virtual machine, disk, and associated network costs.
Serverless compute
For Databricks serverless services, the DBU price includes the underlying virtual machine cost. Serverless can reduce idle capacity and operational work, but it should still be benchmarked with a representative workload.
A higher unit rate can be economical if runtime and administration fall enough; a lower-effort operating model does not automatically mean a lower invoice.
Storage and networking
Databricks commonly uses cloud object storage. Include the actual cloud bill for table data, raw landing zones, Delta history, checkpoints, logs, replicas, and any temporary or derived datasets.
For networking, combine cloud-provider charges with any applicable Databricks networking line items. Databricks documents serverless connectivity and transfer charges separately in its networking cost guidance.
AI and managed services
Model serving, foundation model usage, AI functions, vector search, training, and other managed capabilities can have different usage units.
Capture tokens, endpoint hours, GPU or CPU serving, training, index size, and supporting pipeline compute separately.
Use the same model or the same measured quality target on both platforms; comparing a small model on one side with a higher-quality model on the other is not a valid TCO test.
Databricks usage can be attributed through system.billing.usage and joined with system.billing.list_prices.
The official billing system table guidance shows how to calculate list-price usage by SKU and tag. Contract discounts and cloud infrastructure still need to be reconciled outside that list-price calculation.
The seven cost buckets to put in the same worksheet
| Cost bucket | Snowflake worksheet | Databricks worksheet | Frequent omission |
|---|---|---|---|
| Core compute | Warehouse credits, clusters, active seconds, cloud services adjustment | DBUs by SKU; add VM, disk, and network for classic compute | Idle time, retries, development environments, and concurrency peaks |
| Storage | Average billed compressed TB and retention overhead | Object storage plus histories, checkpoints, logs, replicas, and temporary data | Comparing the same source TB instead of each platform’s billed footprint |
| Transfer and networking | Egress, replication, unloads, sharing, and cross-cloud movement | Cloud egress, NAT or private connectivity, serverless networking, and sharing | BI extracts and traffic between adjacent tools |
| Administration | Account, warehouse, security, governance, budget, and FinOps work | Workspace, policies, security, governance, cloud resources, and FinOps work | Treating employee time as free |
| Engineering labor | SQL, ELT, tuning, testing, incident response, and integrations | Data pipelines, Spark or SQL tuning, testing, incident response, and integrations | Counting initial build but not maintenance and on-call work |
| Managed/serverless services | Snowpipe, search optimization, automatic maintenance, and other feature meters | Serverless jobs or pipelines and managed platform features not already assigned to core compute | Double-counting serverless compute in two buckets |
| AI and ML | AI Credits, tokens, search serving and embedding, pages, messages, training, and generated-query compute | Tokens, serving DBUs, GPU or CPU hours, training, vector search, and supporting jobs | Comparing different models, quality levels, or endpoint availability |
Assign every charge to exactly one bucket. In particular, primary serverless SQL or job compute belongs under core compute; only separate managed-feature usage should appear in the managed/serverless line.
Three illustrative TCO scenarios
The examples below demonstrate the model; they are not vendor quotes or benchmark claims. Direct platform costs represent hypothetical annualized outputs from a representative pilot using contracted rates.
Both platforms are assumed to meet the same performance and reliability target.
Labor is valued at a fully loaded annual cost of $150,000 per FTE. The examples exclude one-time migration cost, taxes, and unused contractual commitments.
Third-party tooling and support are assumed to be equal and are omitted; add the difference if either design replaces or introduces another product. Replace every value with your own measured consumption and labor cost before making a decision.
Scenario 1: SQL-first business intelligence
Workload assumptions
- 12 TB average managed data footprint;
- 500 GB loaded or transformed per day;
- 30 BI users and ten production dashboards;
- a ten-hour weekday query window with moderate concurrency;
- 0.5 TB of cross-region or cross-cloud egress per month;
- no material production AI workload;
- an existing SQL-focused team.
| Annual cost, USD thousands | Snowflake | Databricks |
|---|---|---|
| Core compute | 72.0 | 84.0 |
| Storage | 3.3 | 2.9 |
| Transfer and networking | 0.6 | 0.6 |
| Managed/serverless services | 4.0 | 4.0 |
| Platform administration | 30.0 (0.20 FTE) | 45.0 (0.30 FTE) |
| Engineering labor | 180.0 (1.20 FTE) | 202.5 (1.35 FTE) |
| Annual TCO | 289.9 | 339.0 |
Under these assumptions, Snowflake is approximately 14.5% lower in annual TCO. The result is driven mainly by the existing SQL skill set and lower operating effort, not by storage.
If the Databricks team is already established, the labor gap may disappear and the result can move close to parity.
Scenario 2: large-scale ELT and streaming
Workload assumptions
- 60 TB average managed data footprint;
- 5 TB of new or changed data processed per day;
- continuous ingestion with a 15-minute freshness target plus nightly batch processing;
- 80 analytics consumers and multiple production data products;
- 2 TB of monthly cross-region or cross-cloud egress;
- significant pipeline tuning, testing, and incident-response work.
| Annual cost, USD thousands | Snowflake | Databricks |
|---|---|---|
| Core compute | 360.0 | 264.0 |
| Storage | 16.6 | 14.4 |
| Transfer and networking | 2.4 | 2.4 |
| Managed/serverless services | 48.0 | 36.0 |
| Platform administration | 67.5 (0.45 FTE) | 97.5 (0.65 FTE) |
| Engineering labor | 450.0 (3.00 FTE) | 375.0 (2.50 FTE) |
| Annual TCO | 944.5 | 789.3 |
Under these assumptions, Databricks is approximately 16.4% lower in annual TCO. Databricks carries more platform administration, but lower measured processing cost and fewer engineering hours offset it.
This conclusion should not be generalized to every ELT workload: warehouse utilization, pipeline design, Photon usage, serverless configuration, and team experience can reverse it.
Scenario 3: combined data engineering and production AI
Workload assumptions
- 120 TB of structured and unstructured data;
- 8 TB processed per day across feature, batch-inference, and analytics pipelines;
- weekly model training or fine-tuning;
- 100 million input tokens and 20 million output tokens per month;
- production model serving and a continuously available retrieval layer;
- 5 TB of monthly cross-region or cross-cloud egress;
- the same model quality, latency, availability, and governance target on both platforms.
| Annual cost, USD thousands | Snowflake | Databricks |
|---|---|---|
| Core compute | 480.0 | 360.0 |
| Storage | 33.1 | 28.8 |
| Transfer and networking | 6.0 | 6.0 |
| Managed/serverless and AI consumption | 300.0 | 240.0 |
| Platform administration | 90.0 (0.60 FTE) | 120.0 (0.80 FTE) |
| Engineering and ML labor | 825.0 (5.50 FTE) | 637.5 (4.25 FTE) |
| Annual TCO | 1,734.1 | 1,392.3 |
Under these assumptions, Databricks is approximately 19.7% lower in annual TCO. The main driver is consolidation of data engineering and ML work, not a universal inference-price advantage.
If the Snowflake implementation can satisfy the full use case natively with fewer engineers, or if a different model changes token economics, the gap narrows quickly.
What the scenarios reveal
Labor can outweigh the platform invoice
At a fully loaded cost of $150,000, a difference of 0.5 FTE is worth $75,000 per year. That can outweigh large percentage differences in storage and modest differences in compute.
Use this break-even calculation:
Required FTE saving = annual platform cost premium ÷ fully loaded annual cost per FTE
If one platform costs $60,000 more per year but saves 0.5 FTE at $150,000 per FTE, its net annual TCO is still $15,000 lower.
Storage is rarely the only decision-maker
Storage rates are easy to compare, but storage is often a relatively small share of TCO compared with compute and labor.
It becomes decisive when retention is long, data is replicated across regions, the platform creates a materially different billed footprint, or several copies exist across a multi-tool stack.
Serverless changes the shape of cost
Serverless can reduce idle infrastructure and administrative effort, but it also moves control to feature-specific meters.
Measure complete workloads, including orchestration, maintenance, networking, startup behavior, retries, and supporting services.
AI costs are highly sensitive to workload design
Model choice, output length, prompt caching, retrieval index size, endpoint availability, batch versus real-time processing, and generated-query compute can change AI cost by multiples. A single “price per million tokens” does not represent an end-to-end AI application.
How to run a defensible 30-day TCO assessment
- Define the same output. Set latency, concurrency, freshness, reliability, security, data residency, and model-quality targets before sizing either platform.
- Select representative workloads. Include daily pipelines, the most expensive transformations, peak BI concurrency, one failure-and-retry case, and the production AI path if applicable.
- Use realistic data. Test the actual data distribution, file sizes, change rate, retention, and query patterns. Synthetic volume alone can produce misleading results.
- Tune both implementations. An untuned proof of concept measures team familiarity, not platform economics. Give each design a defined optimization budget.
- Capture every direct meter. Record credits, DBUs, cloud infrastructure, storage, networking, managed services, and AI usage.
- Track human time. Log build, tuning, deployment, access management, monitoring, incident response, and FinOps hours by role.
- Annualize carefully. Model an average month, a peak month, expected data growth, commitments, and at least one failure scenario.
- Run sensitivity tests. Recalculate with compute at plus or minus 20%, data volume at 2×, AI output tokens at 2×, and labor differing by 0.5–1.0 FTE.
Use billing data, not list-price estimates, after the pilot
For Snowflake, reconcile billed credits with METERING_DAILY_HISTORY, use warehouse and query attribution views for compute, and add storage, data transfer, and AI usage histories.
Snowflake budgets and resource monitors can help control future spend, but they do not replace a TCO model.
For Databricks, use system.billing.usage, system.billing.list_prices, tags, and serverless usage policies for platform attribution, then reconcile the result with the cloud-provider bill.
Cloud VMs, disks, object storage, and networking can sit outside the Databricks usage table for classic deployments.
In both cases, compare effective contracted cost rather than headline list price. Include the financial risk of underusing a prepaid commitment and model support or premium-edition charges consistently.
Final recommendation
A Databricks vs Snowflake TCO decision should not be based on a generic claim that one platform is a fixed percentage cheaper.
Snowflake may provide the lower-cost operating model for a focused, SQL-first BI environment.
Databricks may provide the lower TCO for mixed data engineering, streaming, ML, and AI workloads when it reduces processing cost or consolidates engineering work and adjacent tools.
Either result can change with workload shape, negotiated rates, cloud topology, and internal skills.
Build the decision from measured consumption and labor. Keep recurring TCO, one-time migration cost, and business ROI as three separate outputs. Then test the result against growth and staffing assumptions before signing a long-term commitment.
If you need an independent workload baseline, cost benchmark, or migration business case, Dateonic can help you model the options and turn the result into an implementation plan. Explore our Databricks consulting services or contact our team.