
Reliable machine learning and enterprise analytics depend entirely on the health of the underlying data infrastructure. If you cannot monitor data pipelines in Databricks effectively, you cannot guarantee the accuracy of the AI models or executive dashboards deployed downstream.
As an Official Databricks Consulting Partner, we know firsthand that transitioning from reactive troubleshooting to proactive, end-to-end pipeline observability is a requirement for enterprise-scale Data and AI platforms. This guide details the architectural best practices and native Databricks tools necessary to track performance, enforce data quality, and prevent silent failures in production environments.
The Cost of Silent Failures in Data Pipelines
A silent failure occurs when a pipeline execution registers as “Successful” in your orchestration tool, but the output data is incomplete, delayed, or structurally flawed.
For enterprise organizations, these silent failures have a severe cascading effect. A simple schema drift in a raw ingestion feed can skew downstream feature engineering. Because the job itself did not fail, the bad data propagates into Gold-layer tables, leading to stale executive dashboards and severe model drift in production machine learning systems. True observability means knowing the data is correct, not just knowing the compute cluster finished its task.
The Three Layers of Databricks Pipeline Monitoring
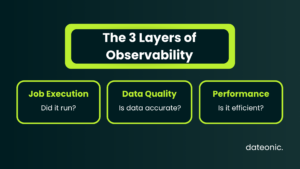
To achieve production-grade observability, data engineering teams must monitor three distinct scopes:
- Job Execution (Reliability): Did the job run successfully? Did it start on time, and did all dependencies resolve correctly?
- Data Quality (Accuracy): Is the data accurate, complete, and structurally sound? Did the pipeline process the expected volume of records?
- Execution Performance (Efficiency): Is the pipeline running efficiently? Are cluster start times, execution durations, and compute costs remaining within expected baselines?
Leveraging Native Databricks Monitoring Tools
Databricks provides a comprehensive ecosystem of native tools to address all three layers of observability.
- Databricks Workflows UI: This provides the baseline matrix view of job statuses, task dependencies, and run histories. It allows engineers to quickly identify which specific task in a multi-step DAG (Directed Acyclic Graph) failed.
- Delta Live Tables (DLT) Expectations: DLT introduces declarative data quality constraints directly into the pipeline code. Engineers can define expectations to monitor quality without halting the pipeline (EXPECT), drop invalid records while continuing (EXPECT OR DROP), or halt execution entirely if strict constraints are violated (EXPECT OR FAIL).
- Databricks Lakehouse Monitoring: This tool automates the tracking of statistical trends and data profiling over time. It provides out-of-the-box anomaly detection, alerting teams if a table’s data distribution suddenly shifts – a critical early warning system for MLOps teams managing feature tables.
| Tool | Primary Purpose | Key Capabilities | Best For |
|---|---|---|---|
| Databricks Workflows | Pipeline orchestration monitoring | Job history, DAG visualization, task-level failures | Operational reliability |
| Delta Live Tables (DLT) | Data quality enforcement | Expectations, validation rules, record filtering | Data accuracy |
| Lakehouse Monitoring | Data observability | Statistical profiling, anomaly detection, drift monitoring | MLOps and feature monitoring |
| Unity Catalog Lineage | Impact analysis | End-to-end data lineage tracking | Root-cause analysis |
| Unity Catalog System Tables | Telemetry and auditing | Queryable platform logs and usage data | Custom monitoring dashboards |
End-to-End Visibility with Unity Catalog System Tables
When a failure occurs, assessing the blast radius is the immediate priority. Unity Catalog provides automated, out-of-the-box data lineage. If a pipeline failure corrupts a Bronze-layer table, data engineers can instantly trace the lineage graph to identify exactly which Silver transformations, Gold tables, and downstream MLflow models are compromised.
Furthermore, Unity Catalog system tables provide a centralized, queryable log of platform activity. Engineers can query these system tables (system.access.audit, system.query.history, etc.) using Databricks SQL to build custom telemetry dashboards.
Note that depending on your workspace creation date, an account admin may need to explicitly enable specific system schemas (like system.billing or system.access) via the Unity Catalog System Schemas API.
Setting Up Proactive Alerts and Webhooks
Checking the Workflows UI after a stakeholder complains about a broken dashboard is reactive. Proactive observability requires automated routing of alerts to the right teams immediately.
Databricks Workflows allows you to configure notifications for job starts, successes, failures, and duration warnings. By leveraging Databricks webhooks – configured easily by navigating to Alert Destinations in the Databricks UI workspace settings – data engineering teams can route these alerts directly into operational channels like PagerDuty, Microsoft Teams, or specific Slack channels. This ensures that a critical failure in a priority pipeline triggers an immediate incident response workflow.
Monitoring Cluster Costs and Performance
Scalable Lakehouse architectures must also be cost-efficient. Tracking cluster utilization and query execution times is vital to prevent compute costs from spiraling.
By querying the system.billing.usage table, teams can track the Databricks Units (DBUs) consumed by specific workloads. You can isolate costs by tagging clusters with specific pipeline or project names:
SELECT
usage_date,
sku_name,
usage_quantity
FROM system.billing.usage
WHERE custom_tags[‘pipeline_name’] = ‘core_ingestion’
ORDER BY usage_date DESC;
Tracking execution runtimes also highlights bottlenecks. A pipeline that gradually takes longer to execute each week indicates a need for table optimization (like OPTIMIZE or ZORDER), partition tuning, or instance type adjustments.
Best Practices for Enterprise Data Teams
- Avoid Alert Fatigue: If everything triggers an alert, engineers will ignore them. Route minor data quality warnings to logging tables for weekly review. Reserve direct PagerDuty alerts for hard pipeline failures or strict SLA breaches.
- Integrate Pipeline Health with MLOps: Monitoring data pipelines and machine learning models are not separate tasks. Extending your observability strategy to monitor inference tables ensures that data drift is caught before it impacts business logic.
- Build Stakeholder Dashboards: Use Databricks SQL to build high-level pipeline health dashboards. Giving stakeholders visibility into SLA compliance and data freshness builds trust in the data platform.
Build Reliable Databricks Workflows with Dateonic
Designing pipelines that process data is only the first step; engineering them to survive real-world failures, scale securely, and support production AI requires deep platform expertise.
As an Official Databricks Consulting Partner, Dateonic specializes in building highly governed, failure-resistant Lakehouse architectures. We help enterprise organizations standardize their MLOps, enforce strict data governance through Unity Catalog, and optimize compute costs across their entire pipeline ecosystem.
For more technical insights on pipeline architecture, explore our technical blog. If you are ready to modernize your data infrastructure and move your AI initiatives out of the discovery phase and into reliable production, talk to a Databricks expert.
FAQ
What is the difference between Databricks Workflows and Delta Live Tables (DLT) for monitoring?
Databricks Workflows monitors the operational execution and orchestration of tasks (success, failure, duration). Delta Live Tables (DLT) monitoring focuses on declarative data quality and pipeline state, using defined “expectations” to track the validity of the data moving through the pipeline.
How does Lakehouse Monitoring help with machine learning?
Lakehouse Monitoring tracks statistical distributions and data profiles over time. For MLOps, this is critical for detecting feature drift or label drift in inference tables, alerting data science teams before a model’s predictive accuracy degrades.
Can I monitor custom metrics in Databricks?
Yes. You can write custom pipeline telemetry – such as rows processed, API response times, or specific data validation checks – into dedicated Delta tables, and visualize those custom metrics using Databricks SQL dashboards.
Conclusion
Monitoring data pipelines in Databricks requires more than checking for green checkmarks in a job scheduler. By combining native tools like Delta Live Tables expectations, Lakehouse Monitoring, and Unity Catalog lineage, enterprise teams can achieve true data observability – ensuring that downstream analytics and AI models are fueled by accurate, highly reliable data.