
Your Databricks bill arrived. The number is larger than last quarter – again. The cluster logs show activity, but nobody can explain exactly why you burned through that many Databricks Units (DBUs). Your team is guessing. Your CFO is asking questions you can’t answer cleanly.
This is not a Databricks problem. It is an architecture and configuration problem – one rooted in a fundamental misunderstanding of how the DBU pricing model actually works at the infrastructure level. Most teams treat DBUs as a black box and optimize costs by intuition. That approach fails at scale, every time.
At Dateonic, we audit, redesign, and continuously optimize Databricks environments for enterprises across manufacturing, financial services, and logistics. What follows is the architectural playbook we use internally – applied to the exact problems costing your organization money today.
Why DBU Consumption Spirals Out of Control
Before you can fix the problem, you need to understand the DBU model at a level most documentation glosses over.
DBUs are not billed per query. They are billed per compute-hour, per node, weighted by instance type and tier. A Standard tier cluster on m5d.4xlarge nodes running for 4 hours costs fundamentally differently than the same workload run on m6i.2xlarge nodes with Photon enabled on the Premium tier – even if the wall-clock time is identical.
The four compounding factors that silently inflate your bill:
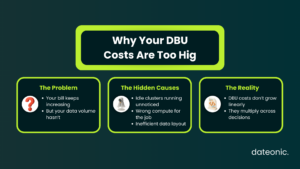
- Idle compute: Clusters not configured with aggressive auto-termination, particularly in interactive BI or notebook workflows.
- Wrong cluster policy for the workload: All-purpose clusters billed at higher DBU rates used for scheduled batch jobs that should run on Jobs Compute.
- Data layout inefficiency: Full table scans caused by unoptimized file sizes, missing Z-order indexes, or absent Liquid Clustering, forcing Spark to spin longer.
- Unity Catalog overhead neglect: Ungoverned data access patterns creating redundant compute for lineage and permission resolution at scale.
The relationship between these factors is multiplicative, not additive. Fix one without the others, and the savings are marginal.
The Technical Architecture of DBU Reduction
1. Align Cluster Tiers to Workload Profiles
This is the highest-leverage change most organizations are not making. Databricks exposes three primary compute surfaces, each carrying a different DBU multiplier.
| Compute Type | Typical DBU Rate | Optimal Use Case |
|---|---|---|
| All-Purpose Cluster | 1.0× (Standard) / higher (Premium) | Interactive development, ad hoc exploration |
| Jobs Compute | ~0.3× to 0.5× lower | Scheduled ETL, batch ML pipelines |
| SQL Warehouse (Serverless) | Usage-based, auto-suspend | BI queries, dashboards, ad hoc SQL |
| SQL Warehouse (Classic) | Fixed cluster size | Predictable, high-concurrency SQL |
Running production ETL on All-Purpose clusters is one of the single most common and most expensive mistakes we see in enterprise environments. Migrating those workloads to Jobs Compute via Databricks Workflows typically yields 30–50% DBU reduction on batch workloads alone – with zero change to business logic.
2. Enable Photon – But Only Where It Earns Its Cost
Photon is Databricks’ vectorized query engine written in C++. It accelerates SQL and DataFrame operations dramatically – but it carries a DBU surcharge (typically ~1.0× additional DBU multiplier on top of the base rate).
Photon delivers positive ROI when:
- Queries involve large aggregations, joins, or scans over wide columnar tables.
- You are running Delta Lake format with deletion vectors enabled.
- The workload is strictly compute-bound rather than I/O-bound.
Photon delivers negative ROI when applied indiscriminately to small datasets, streaming micro-batches, or Python UDF-heavy pipelines (Photon cannot accelerate arbitrary Python UDFs). Profile your workloads using the Databricks Query Profile to identify scan and shuffle bottlenecks first.
3. Implement Liquid Clustering to Eliminate Unnecessary Scans
Legacy Z-order indexing requires manual OPTIMIZE runs and degrades with incremental writes. Liquid Clustering, introduced as GA in Databricks Runtime 13.3 LTS, replaces Z-order with an incremental, write-optimized clustering strategy.
— Enable Liquid Clustering on an existing Delta table
ALTER TABLE orders CLUSTER BY (order_date, region_id);
— New table with Liquid Clustering
CREATE TABLE transactions
CLUSTER BY (transaction_date, customer_id)
AS SELECT * FROM raw_transactions;
For a table receiving daily incremental loads, Liquid Clustering reduces the full OPTIMIZE maintenance window from hours to minutes by clustering only newly written files. A well-clustered 10TB Delta table can reduce per-query DBU consumption by 40–70% compared to an unclustered or improperly Z-ordered table. That translates directly to dollars.
4. Govern Compute with Unity Catalog and Cluster Policies
Unity Catalog (UC) is not just a governance tool – it is a DBU optimization mechanism when configured correctly. By centralizing data access patterns, UC eliminates redundant compute caused by:
- Duplicate dataset materializations across team-level schemas.
- Uncontrolled proliferation of external Hive Metastore-backed tables.
- Absence of row-level security pushdown, forcing post-scan filtering.
Pair UC with enforced Cluster Policies to hard-cap instance types, enforce auto-termination windows, and prevent All-Purpose cluster creation by non-privileged roles. Without policies, individual contributors will always choose the largest, most convenient cluster.
💡 Ready to fix this? Dateonic’s architects perform a structured DBU Consumption Audit that identifies your top 5 cost drivers and delivers a remediation roadmap within 2 weeks – with projected savings quantified per workload. Book your free Architecture Consultation with Dateonic →
The Dateonic DBU Optimization Methodology
We do not sell recommendations. We implement them. Here is the exact framework we apply to every client engagement:
- Step 1: Instrumented Audit (Week 1)
We instrument your workspace using Databricks System Tables to produce a granular breakdown of DBU consumption by cluster, user, job, and query pattern over a rolling 90-day window. - Step 2: Workload Reclassification (Week 2)
Batch pipelines are migrated to Jobs Compute. SQL analytics workloads are migrated to appropriately sized SQL Warehouses with aggressive auto-suspend. Photon enablement is validated with a before/after DBU comparison. - Step 3: Data Layer Optimization (Weeks 3–4)
We implement Liquid Clustering on high-scan Delta tables, enable Deletion Vectors, and enforce file size targets (128–256MB) to eliminate small-file overhead. - Step 4: Policy and Governance Hardening (Week 4–5)
We deploy Cluster Policies across all workspace personas, enforce Unity Catalog as the single metastore, and implement budget alerts via the Databricks Account Console. - Step 5: Continuous Optimization Baseline
We configure a monitoring dashboard using Databricks Lakehouse Monitoring that gives your platform team weekly visibility into DBU trends and cluster efficiency scores.
The Business Case: DBU Optimization Is Not a Cost Center Activity
Uncontrolled DBU consumption is a symptom of architectural debt, not an inevitable cost of scale. Every dollar spent on unnecessary compute is a dollar not spent on expanding your data platform or accelerating ML model deployment cycles.
The ROI framework is straightforward:
- Immediate savings: Workload reclassification typically pays for an optimization engagement within 60–90 days.
- Compounding savings: Liquid Clustering efficiency widens the gap between clustered and unclustered tables as data volumes increase.
- Risk reduction: Cluster Policies and Unity Catalog prevent future cost spikes from ungoverned compute creation.
You already know your bill is too high. The question is whether you will address it architecturally or continue managing it reactively, quarter by quarter.